
The BESIII collaboration recently reported the first observation of the semileptonic decays D⁰ → K⁻ ω e⁺ νₑ and D⁺ → K_S⁰ ω e⁺ νₑ with significances of 8.0σ and 5.8σ, respectively. The measurement is based on 20.3 fb⁻¹ of e⁺ e⁻ annihilation data collected at a center-of-mass energy of 3.773 GeV. This work provides the most precise measurement of the branching fraction (BF) of K̅₁(1270) → K̅ ω decay from a collider experiment to date, and offers unique experimental evidence for the two-pole structure of the K̅₁(1270) resonance. The results have been published recently in Physical Review Letters on 26 August, 2026 [Phys. Rev. Lett. 137, 091802].
Understanding the internal structure of hadrons is a central challenge in modern particle physics. Quantum Chromodynamics (QCD), which describes the strong interaction, cannot be treated perturbatively in the low-energy regime because the coupling constant becomes large, thus requiring nonperturbative tools such as chiral perturbation theory and lattice QCD. In semileptonic decays of charm mesons, the weak and strong interactions are well separated, making these processes an ideal laboratory for probing strong-interaction dynamics. Axial-vector strange meson, K̅₁(1270), has attracted significant theoretical and experimental interest. Its decays into K̅ π π involve interference of multiple intermediate channels such as K̅* π and K̅ ρ, complicating the extraction of its properties. In contrast, the K̅ ω decay mode—where the ω meson has a narrow width and there is negligible contribution from other strange resonances—offers a cleaner environment, eliminating multichannel interference effects. Moreover, A two-pole interpretation for the K̅₁(1270) meson has been proposed and exploited theoretically, where the lower (higher) mass pole couples predominantly to the K̅* π (K̅ ρ) channel. Because of phase-space limitations and the narrow width of the ω meson, the lower mass pole (theoretically predicted at around 1195 MeV/c²) can hardly couple to the K̅ ω channel. Therefore, this decay mode serves as an ideal probe to isolate the higher-mass pole and test the two-pole hypothesis.
In this work, based on 20.3 fb⁻¹ of e⁺ e⁻ annihilation data collected at a center-of-mass energy of 3.773 GeV, the BESIII collaboration employs the double-tag method and measures the BFs of D⁰ → K⁻ ω e⁺ νₑ and D⁺ → K_S⁰ ω e⁺ νₑ to be B(D⁰ → K⁻ ω e⁺ νₑ) = (9.4₋₁.₈⁺².⁰ ± 0.6) × 10⁻⁵ and B(D⁺ → K_S⁰ ω e⁺ νₑ) = (8.0₋₂.₁⁺².⁴ ± 0.7) × 10⁻⁵, where the first uncertainties are statistical and the second systematic. Combining these with previous BESIII measurements of D⁰⁽⁺⁾ → K⁻ π⁺ π⁻⁽⁰⁾ e⁺ νₑ and assuming K̅₁(1270) to be the sole mediating resonance in all processes, the decay width ratios are determined to be Γ(K₁(1270)⁻ → K⁻ π⁺ π⁻) / Γ(K₁(1270)⁻ → K⁻ ω) = 3.4₋₀.₇⁺⁰.⁸ ± 0.3 and Γ(K̅₁(1270)⁰ → K⁻ π⁺ π⁰) / Γ(K̅₁(1270)⁰ → K̅⁰ ω) = 7.9₋₂.₁⁺².⁴ ± 0.7. Assuming isospin symmetry, the combined BF is determined to be B(K̅₁(1270) → K̅ ω) = (8.4 ± 1.4 ± 0.5)%, which is the most precise measurement from a collider experiment to date (see Fig. 1). Most notably, for the first time via a single vector–pseudoscalar decay channel, the mass of the K̅₁(1270) meson is measured to be m(K̅₁(1270))^K̅ω = (1336 ± 9 ± 2) MeV/c² (see Fig. 2). This value is significantly higher than m(K̅₁(1270))^K̅ππ = (1271 ± 3 ± 7) MeV/c² from K̅₁(1270) → K̅ π π decays, providing unique experimental support for the two-pole structure of the K̅₁(1270) meson. This work is expected to inspire future K̅₁(1270)-related studies, in decays such as B → K̅ ω γ and B → K̅ ω l⁺ l⁻, and provides valuable input for refining theoretical descriptions of the K̅₁(1270) meson.
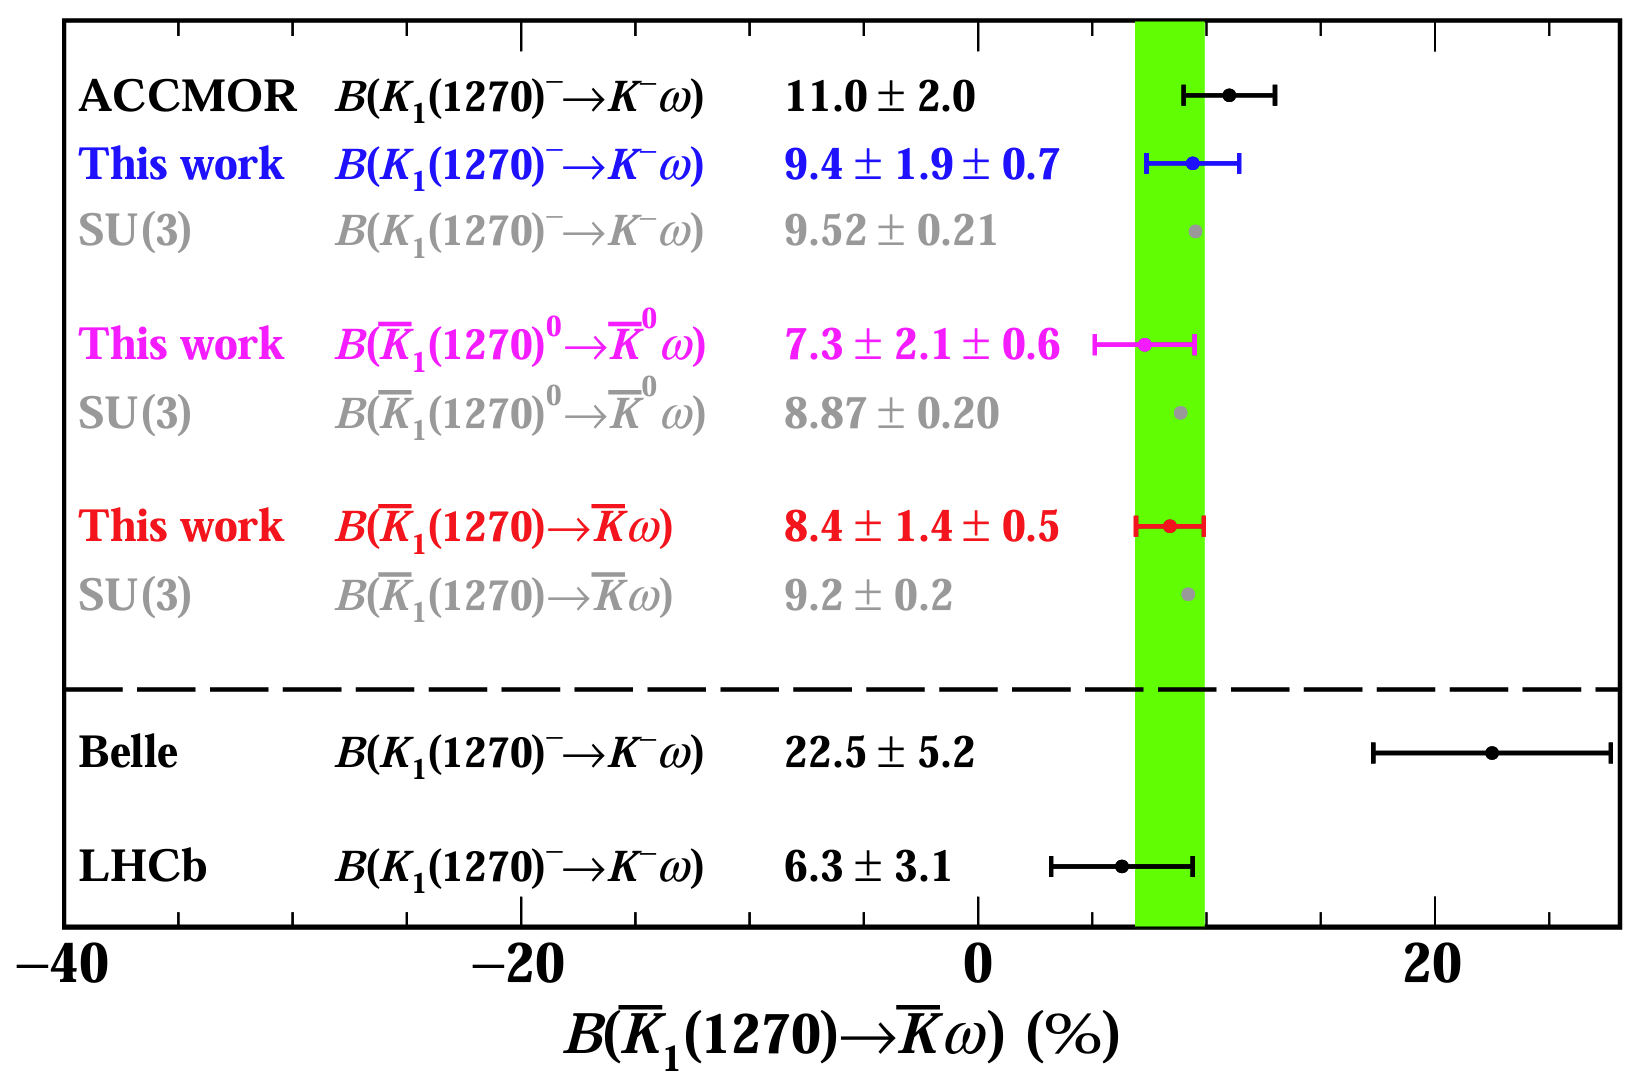
Fig. 1: Comparison of the K̅₁(1270) → K̅ ω measured in this work with previous experimental measurements and theoretical predictions
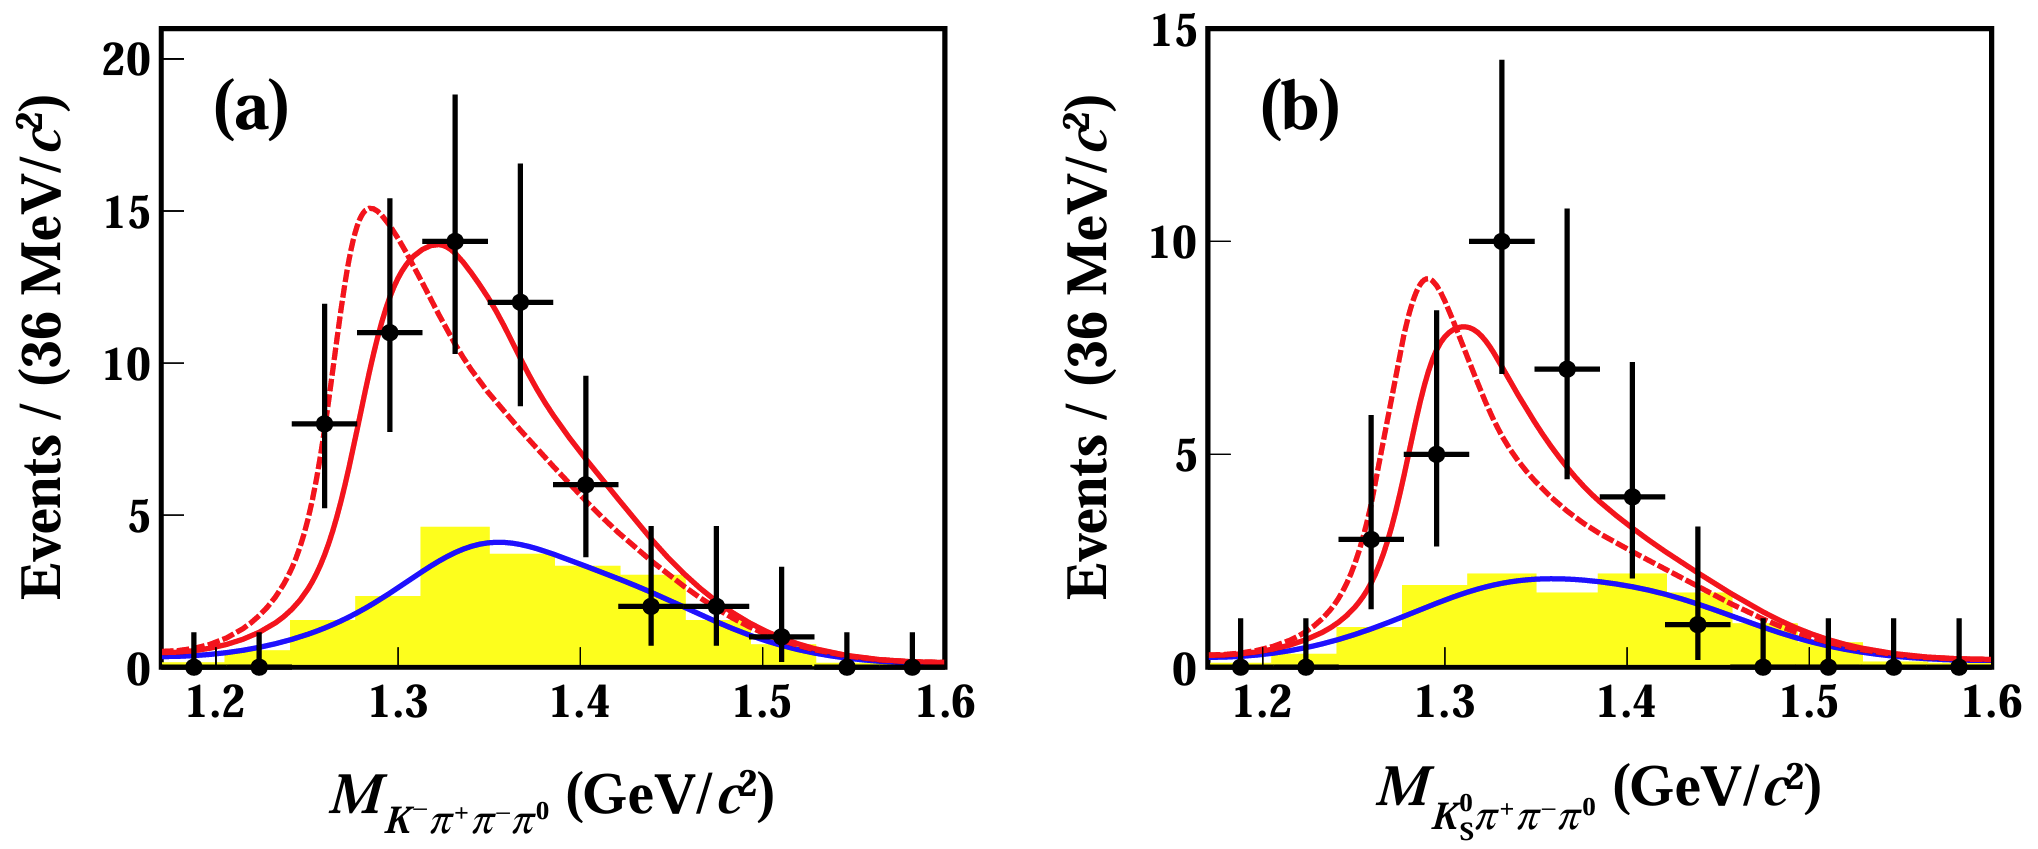
Fig. 2: The K̅₁(1270) mass spectrum obtained in this work. The red solid and dashed curves represent signal MC samples with input K̅₁(1270) masses of 1336 MeV/c² and 1272 MeV/c², respectively. The blue solid curve and yellow histogram represent the background contributions. The black points with error bars are real data
Further reading:
Phys. Rev. Lett. publication link:https://link.aps.org/doi/10.1103/xn4s-xxs8
arXiv link: https://arxiv.org/abs/2601.01817